
Reading your reports
Revenue, busiest machines, and the profit line after expenses.
Analytics holds four reports that answer four different questions. They share one control, so start there.
The period buttons
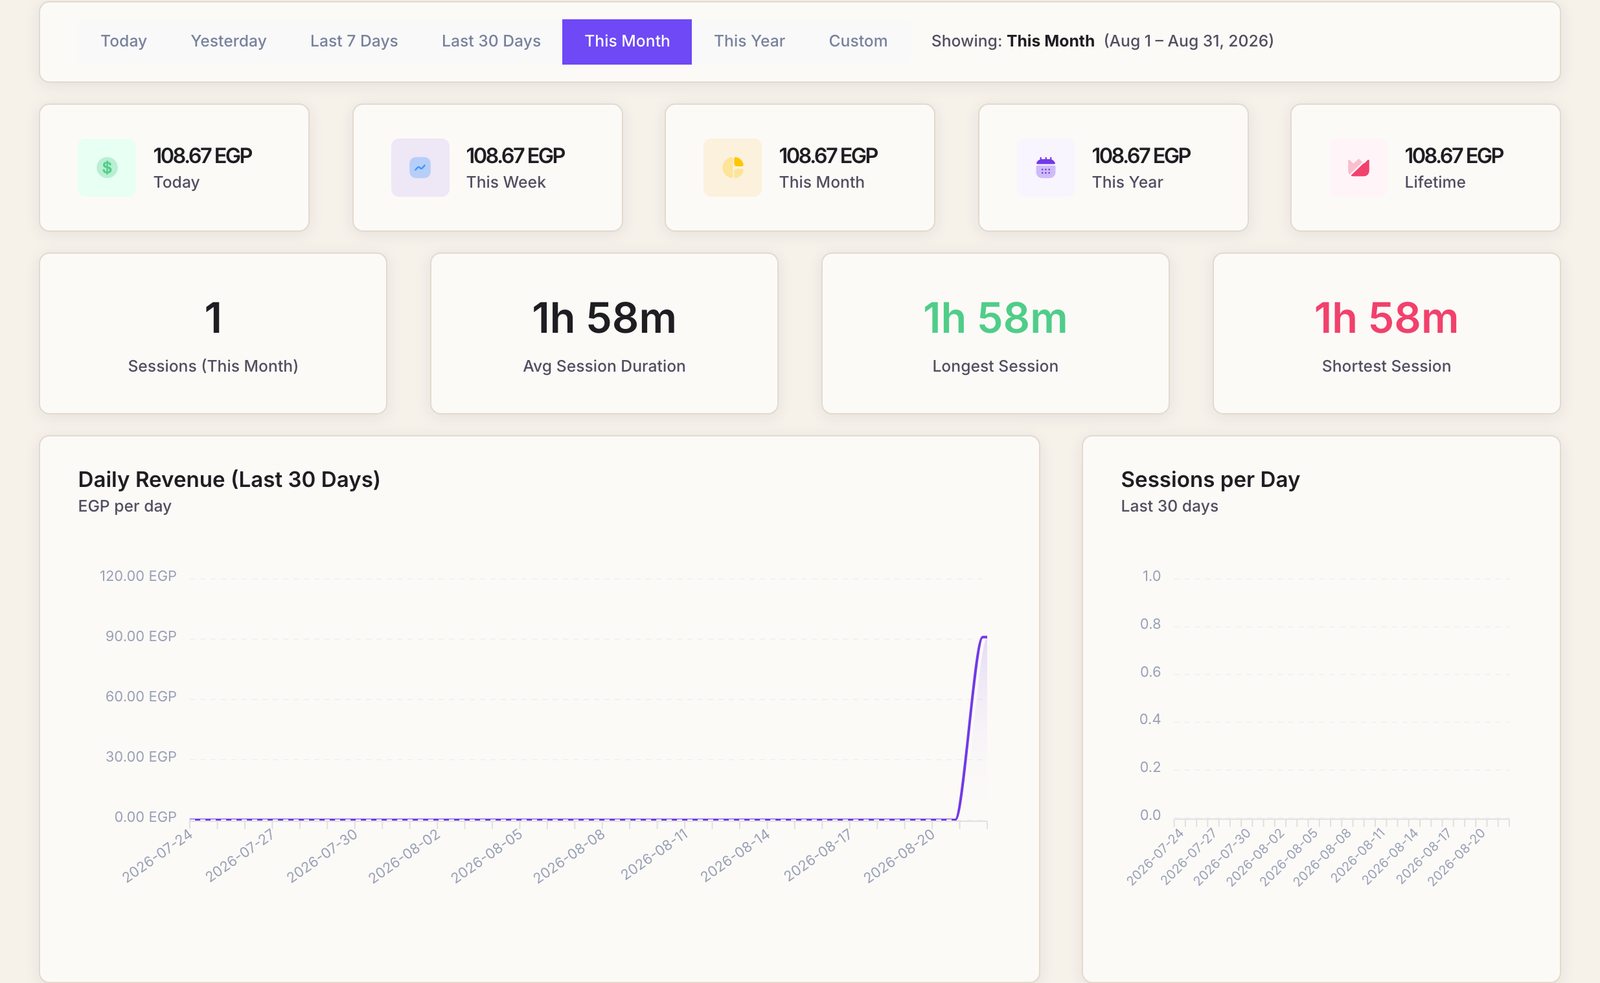
Every analytics page opens on this month and carries the same row of buttons: Today, Yesterday, Last 7 Days, Last 30 Days, This Month, This Year and Custom for your own dates. A line underneath always spells out the range being counted, so a screenshot of a number is never ambiguous.
Revenue
Analytics → Revenue. Takings across today, this week, this month, this year and lifetime, then the shape of your gaming: how many sessions in the period, and the average, longest and shortest session.
Two charts follow — revenue per day and sessions per day over the last thirty. Read them together: the same money from fewer, longer sessions is a different business from the same money from a crowd.
Devices
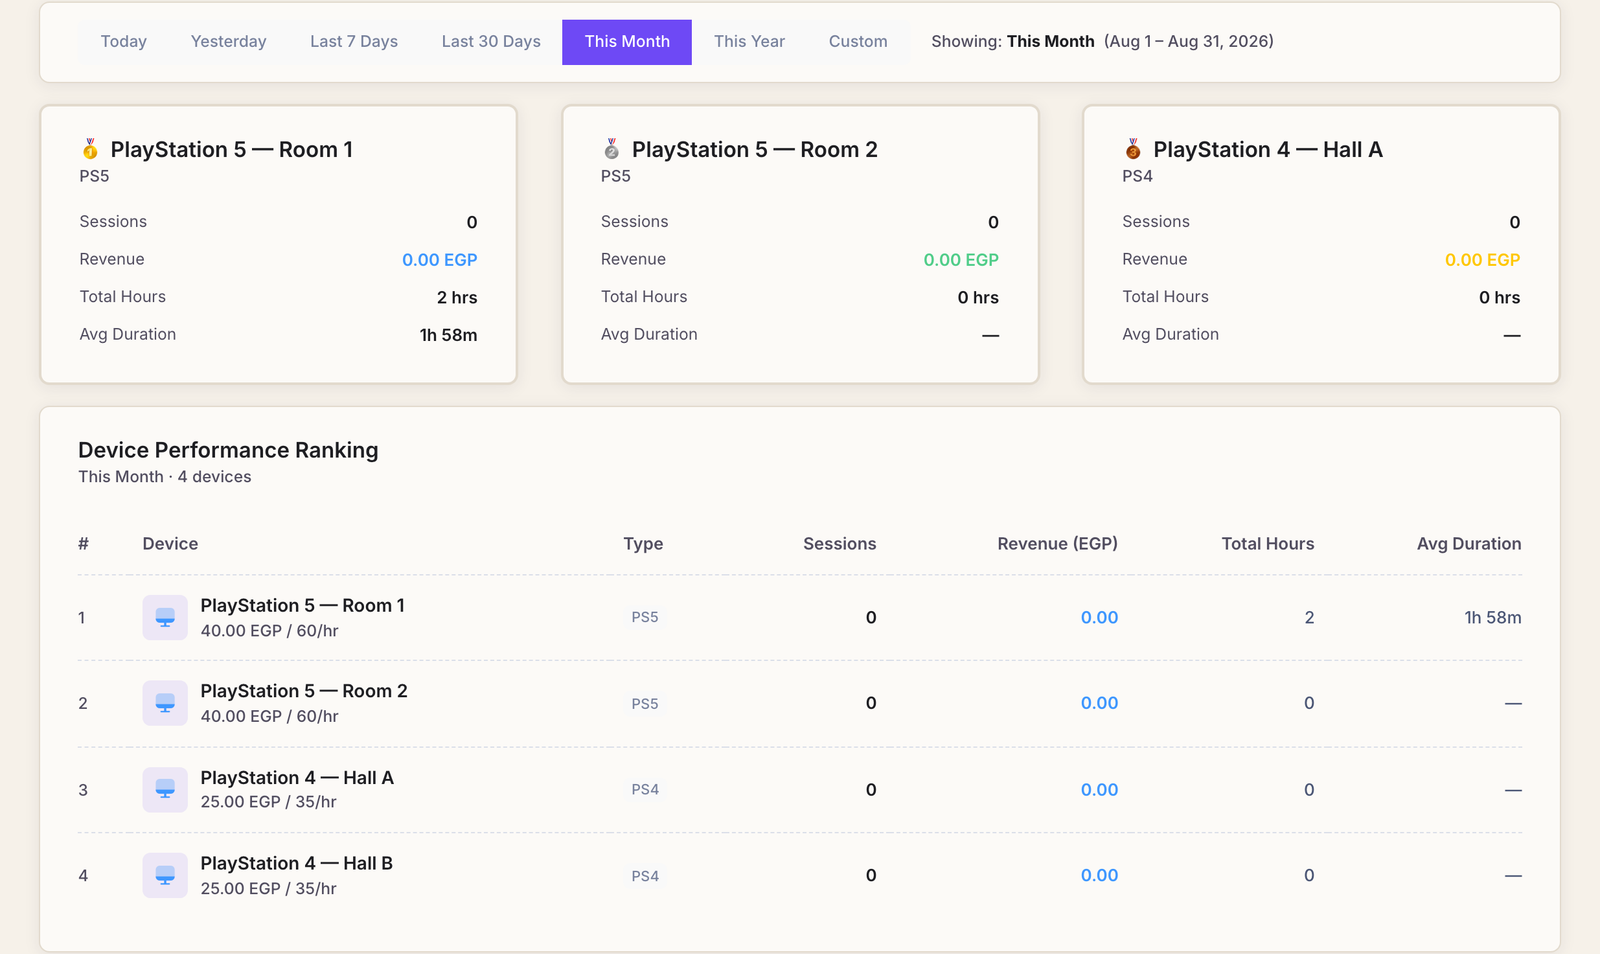
Analytics → Devices ranks your machines for the period: sessions, revenue, total hours and average session length, with the top three called out.
This is the report that pays for itself. The machine at the bottom of the list is either in the wrong corner of the room, priced wrong, or genuinely surplus — and the one at the top tells you what to buy next.
Employees
Analytics → Employees shows what each member of staff took in over the period. It is a workload picture as much as a performance one: the person on every Friday night will always be ahead of the person on Tuesday mornings.
Profit Tracking
Analytics → Profit Tracking is the one number the other reports are building towards. Four tiles:
- Revenue — everything that came in.
- Cost of Goods — what the products you sold cost you, from their purchase prices.
- Expenses — the rent, the bills, everything you recorded.
- Net Profit — revenue minus the two, with the margin beside it.
Below them, revenue against expenses day by day, a profit trend, and a summary table repeating the calculation for today, this month, this year and lifetime.
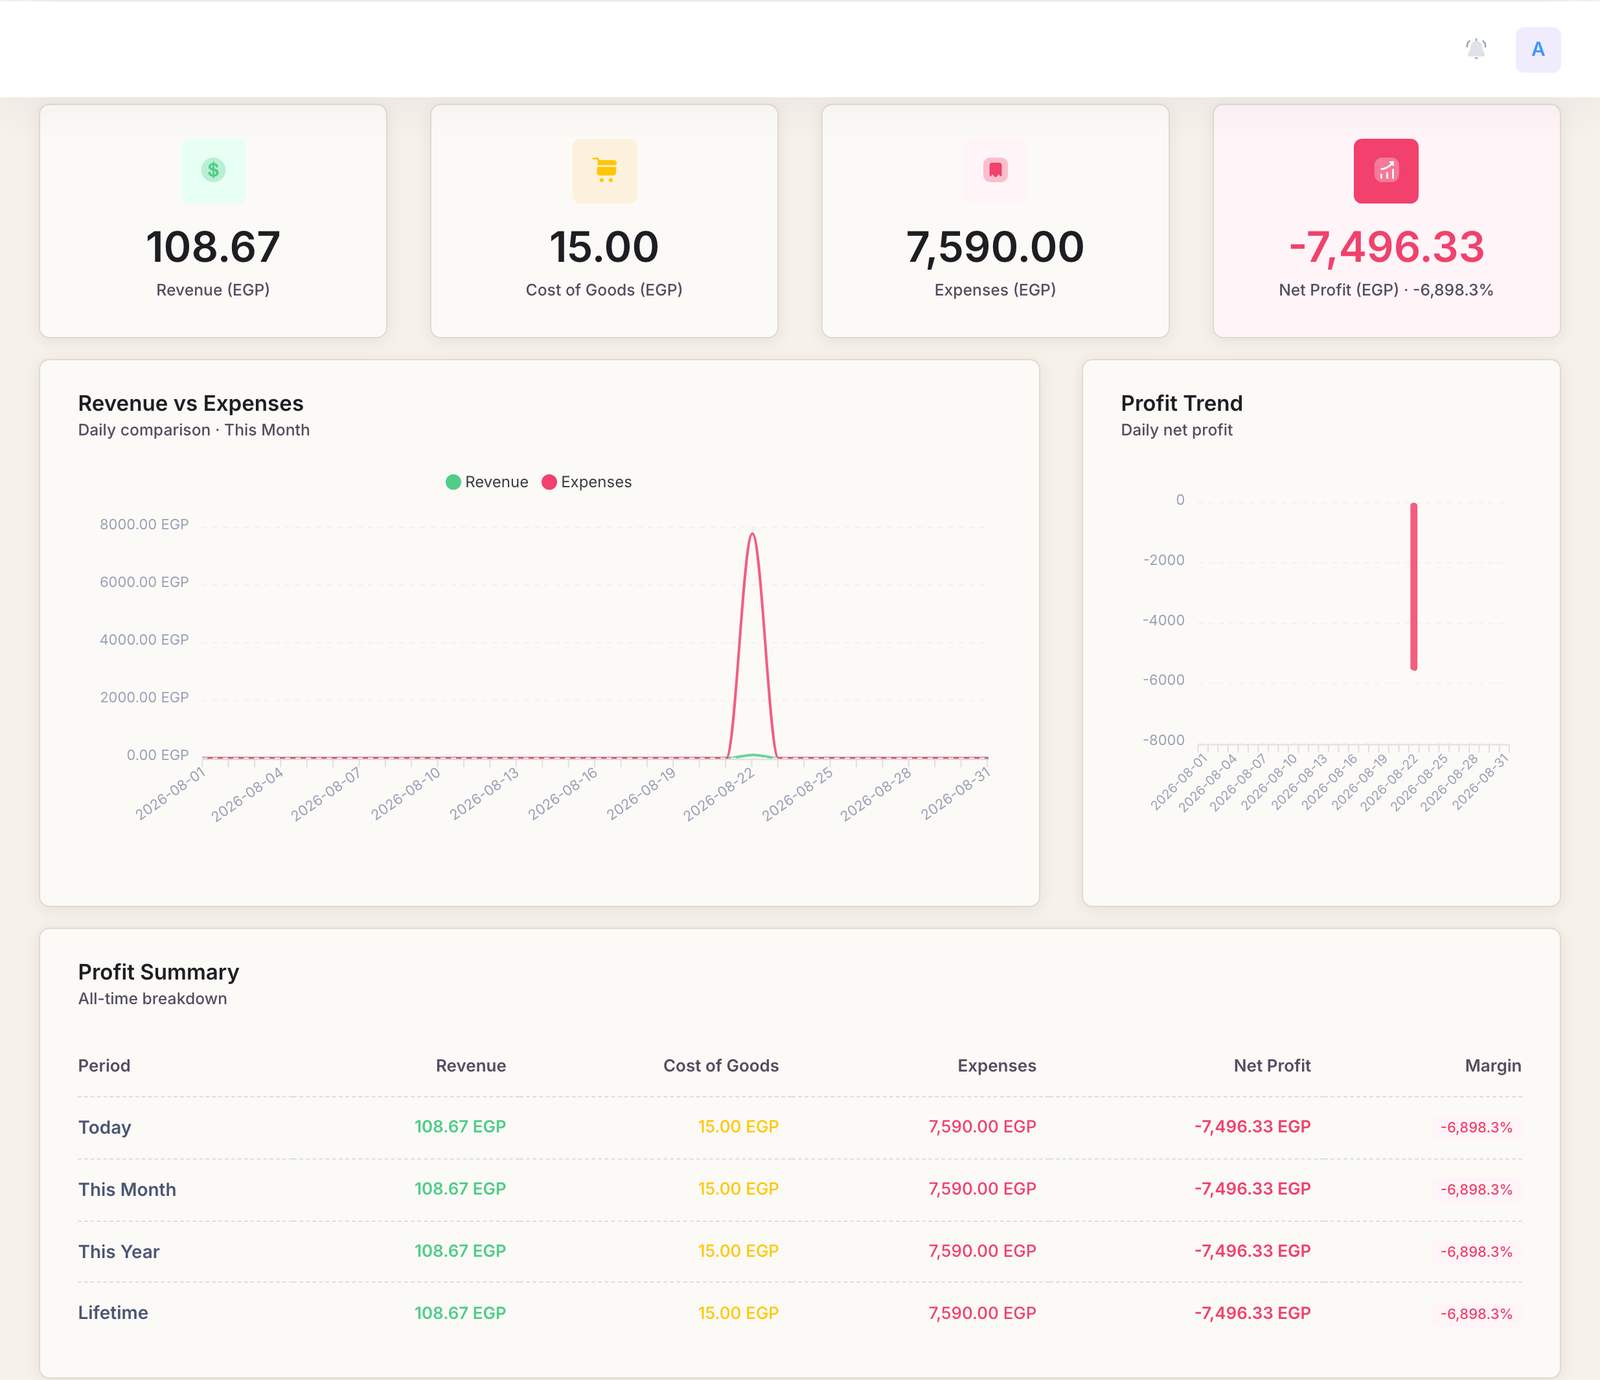
Net profit is only as honest as what you feed it. Miss the purchase price on a product and its cost never appears; skip the rent and the margin is fiction. The report is arithmetic, not an estimate.
A weekly habit
Ten minutes, once a week, in this order:
- Revenue on Last 7 Days — is the week up or down?
- Devices on the same range — which machines carried it?
- Profit Tracking on This Month — is the month still on course?
- Low Stock — write the shopping list before the weekend.
Common questions
Revenue and Profit Tracking disagree.
They are measuring different things. Revenue is money in; Profit Tracking subtracts cost of goods and expenses from it. If profit is far lower, that is the expenses doing their job.
Why is a machine showing zero?
No sessions on it in the period you picked. Widen the range, or check whether it is in Maintenance or frozen.
Can employees see these reports?
Only with the analytics and revenue permissions, which most floor staff do not need. See adding an employee.
Can I get the numbers out of Rank?
Expenses and sales both export for the period you are looking at, from the buttons on their own pages.